July 16, 2026
Edward Driggers, PhD and Duncan Holbrook-Smith, PhD
Lipidomics data presents a challenging problem: the complexity of lipid molecules and the unique structure of lipid-based pathways in cells and organisms make it very difficult to represent the lipid metabolic network. This makes it much harder to put the data into a meaningful and readily ingestible biological context. The magnitude of this problem has been amplified in recent years by the development of mass spec technologies that have expanded coverage in the lipidome without altering the fundamental structure of lipid metabolic pathways – this is a fundamental gap in lipidomics that deserves more attention than it often receives.
At GMet, we tend to emphasize that the difference between metabolomics and lipidomics is largely a technological distinction, not a biological one: sure, we must use different LC-MS approaches for the two categories, but lipids and polar metabolites are still just small-molecule substrates for various metabolic enzymes. Central metabolic pathways directly feed into fatty acid and lipid biosynthesis pathways, while lipid and fatty acid degradation deliver carbon and energy back into pathways that we usually classify as central polar metabolite pathways.
However, that simplified argument ignores some important fundamental differences that go beyond the relative polarity of the molecule classes themselves. These distinctions are deeply embedded in the way networks and biochemical pathways for polar metabolites vs. lipids have been structured by the forces of biological evolution, and they significantly constrain our ability to visualize fatty acids and lipids in the context of their biochemical pathways.
Let’s start by revisiting a classic network representation of metabolism:
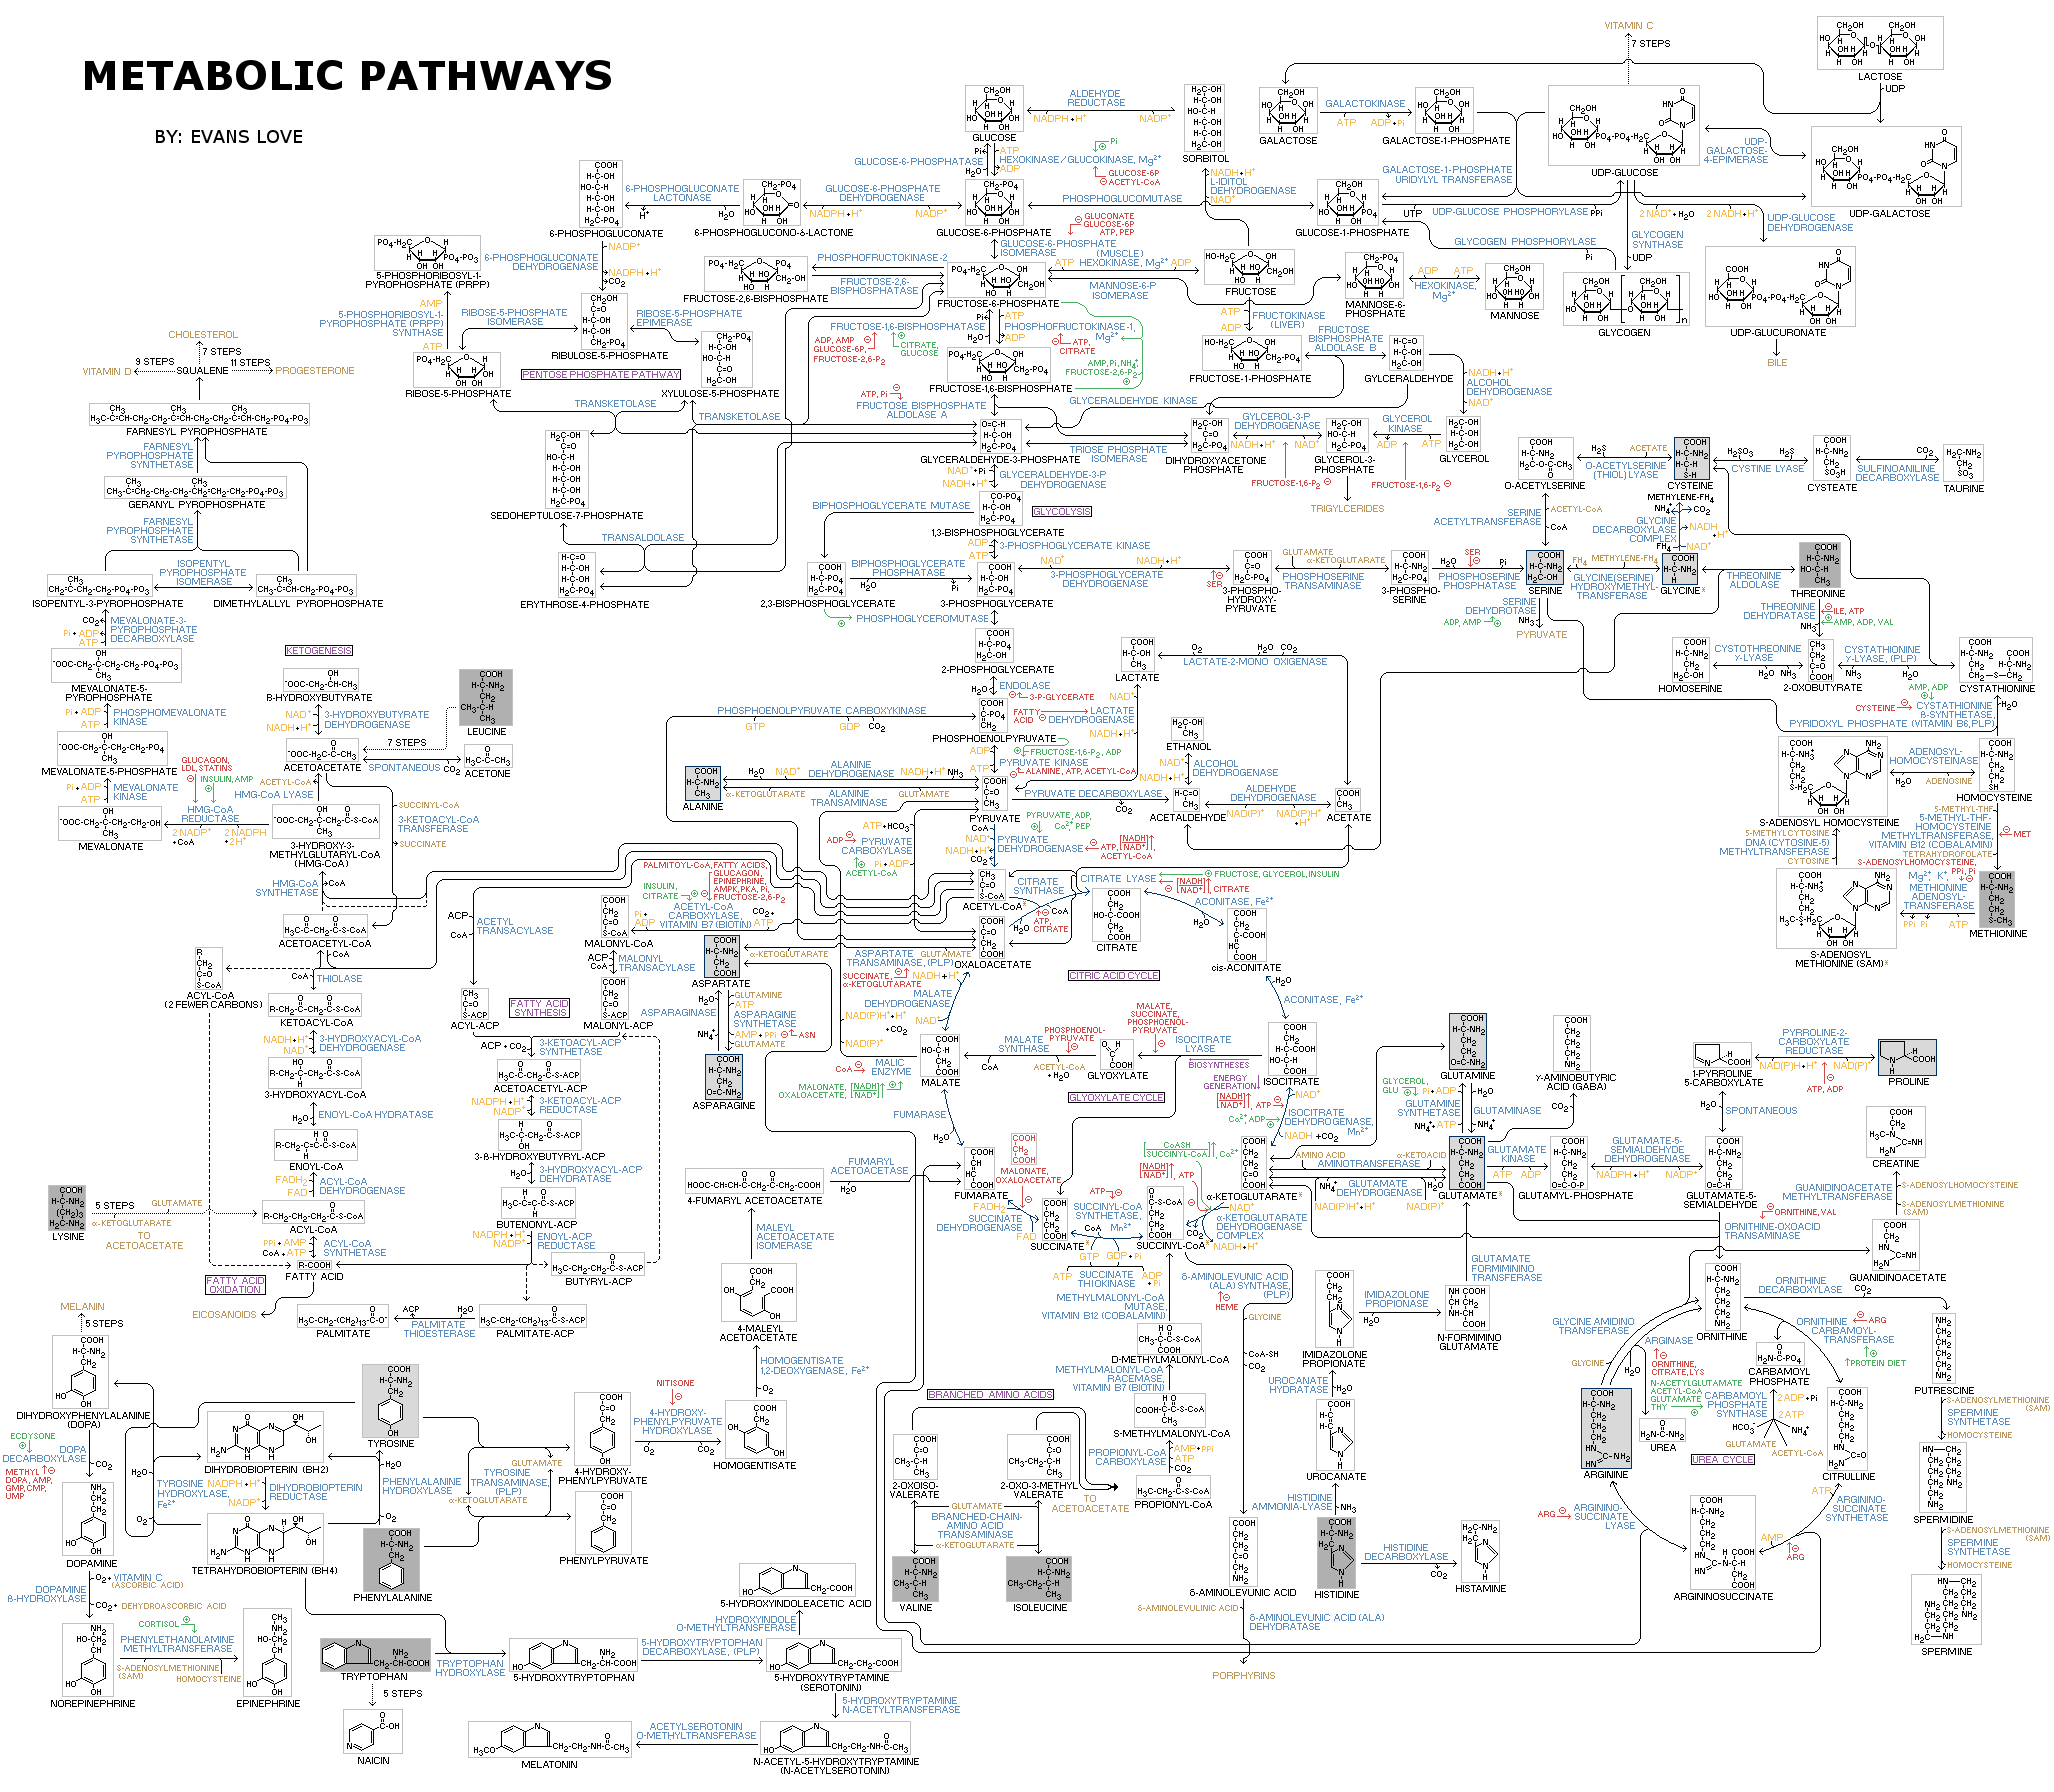
In this visualization, each metabolite “node” sits at the end of an enzymatic “edge” that catalyzes a reaction. This approach to rendering the relationships between metabolites and enzymatic transformations works because so much of the central metabolic network has a one-to-one (or sometimes one-to-a few) relationship between an enzyme and a substrate. As we are taught in biochemistry 101, enzymes are specific for their substrates. A biochemical network that is structured this way is easily visualized in two dimensions, flattened out onto a page without losing too much information. Admittedly, this representation is complicated, but it fundamentally captures many of the important relationships within and between polar metabolic pathways.
This framework cannot easily be applied to lipids, however. This is in part because lipid molecules themselves have a highly modular structure. Any given lipid molecule can possess both a polar headgroup with a variety of functional groups and multiple attached acyl chains; the acyl chains can have different lengths, different saturation states, and possess more exotic modifications, such as epoxides, ketones, or ethers. Because acyl chains can be added, removed, saturated, or desaturated, and head groups can be interconverted, multiple lipids with very distinct structures and functions are only separated from each other by a few enzymatic reactions. Through evolution, lipid reactions are catalyzed by a limited set of enzymes used repeatedly for a very wide range of lipids. Said in terms of graph structure, the same edge is connected to many nodes simultaneously. This tight, high-dimensional structure for lipid networks means that it’s intrinsically hard to depict lipid metabolism efficiently in a 2D space without losing a lot of important information.
This dimensional challenge has led to most analyses of lipids being focused on their role as individual end-point molecules. I.e., is there a change in the abundance of a signaling lipid? A hormone? A structural membrane lipid? Or changes in a relatively narrow class of lipids, such as phosphatidylserines or sphingolipids?
What are the consequences of only recognizing lipids as metabolic end points if we don’t think in terms of lipid networks, even though those networks are central to lipid biology?
A specific example can provide additional insight into this challenging aspect of lipidomics. A single enzymatic carboxylation/decarboxylation step can interconvert fully formed phosphatidylethanolamines (PEs) and phosphatidylserines (PSs), and this interconversion has been linked to muscle myopathy as well as aging of the brain. Thus, the fact that various PEs and PSs are not endpoints is directly tied to human disease. The enzyme converting PSs to PEs preferentially yields highly unsaturated fatty-acid-containing PEs, while de novo synthesis through the Kennedy Pathway tends to produce PEs with a single desaturation. To capture and visualize these effects in the context of a patient cohort with myopathy, lipidomics would greatly benefit from interactive network visualizations, where the user can explicitly connect individual PEs and PCs, depending on their fatty-acid components, and compare those with a healthy control cohort. In fact, without such a tool, finding patterns of PE vs. PS fatty acid composition in the context of a new disease becomes extremely difficult – the domain of lipid experts rather than exploratory researchers. We need interactive report visualizations that cut across lipid classes to capture relevant effects in larger lipid reaction networks. Without these connections, we all tend to incorrectly balkanize lipids and lipid classes.
At GMet, we’ve been exploring new ways to address these and related lipidomics challenges by helping researchers visualize their lipidomics data in a more biologically meaningful way. This summer, we’ll be introducing a new interactive analysis environment as part of our lipidomics services, designed to help researchers move beyond traditional lipidomics reports and gain deeper insight from their data. Stay tuned as we share more about this new capability in the next few weeks and how it will help researchers explore their lipidomics data in an entirely new way.