

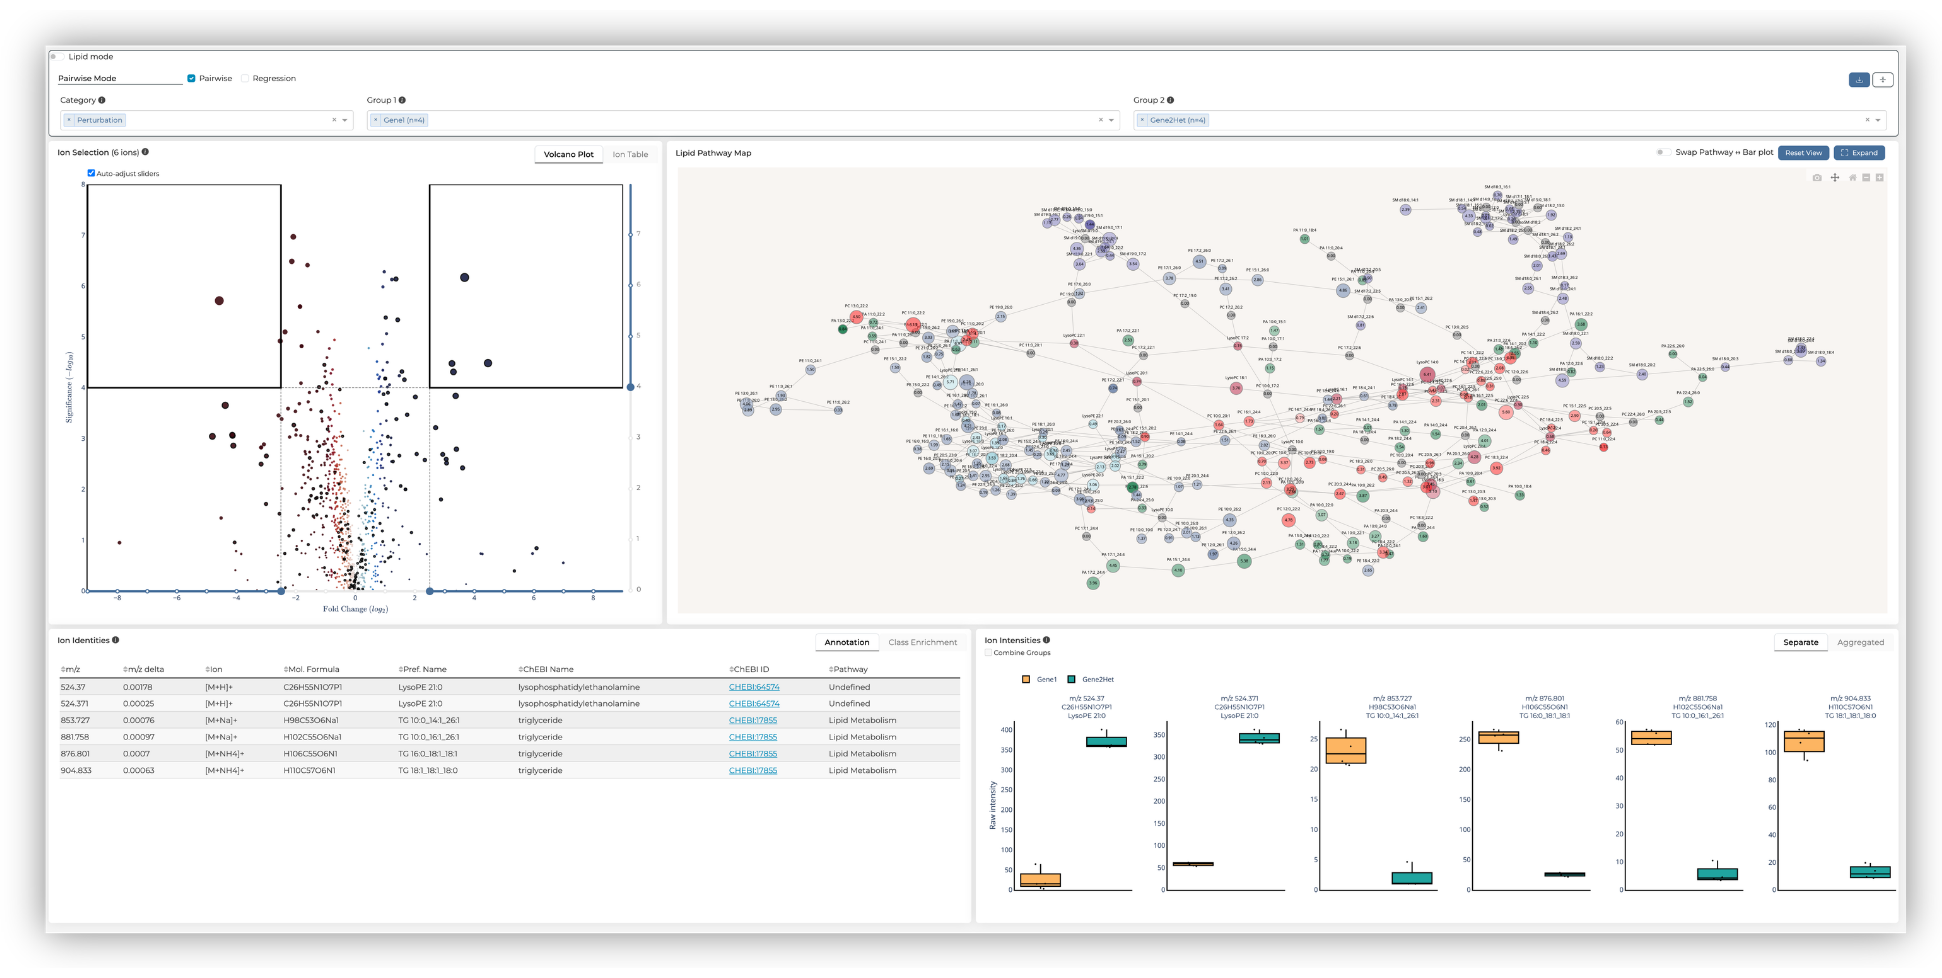
Lipidomics Data Analysis Dashboard
Go beyond data generation with lipidomics services that help you gain meaningful insight from your results. Every GMet untargeted lipidomics study now includes an interactive data analysis environment that helps researchers visualize their data, explore biological relationships, and gain deeper insight from their results.
Interpreting your complex lipidomics results is just as important as generating them. However, traditional reports often present static tables and figures that provide limited insight into how they’re connected through pathways, enzymatic processes, or regulatory networks.
As part of GMet’s untargeted lipidomics offering, you’ll receive access to an interactive data analysis environment that goes beyond traditional class-based, semi-interactive HTML reports. Using network visualizations and fully composable metadata, you can explore relationships between lipid species across classes, investigate biologically meaningful patterns, and gain deeper insight into your data from multiple perspectives. The result is a more intuitive way to understand complex lipidomics datasets, even for researchers who aren’t lipid biology experts.




Once your study is complete, you’ll receive access to an interactive dashboard where you can interrogate your results using multiple dynamic views. Filter your data, compare sample groups, and investigate biologically meaningful patterns all within a single analysis environment.
Create differential comparisons or linear regression analyses using flexible, composable metadata filters

Generate an interactive volcano plot that updates based on your metadata selection and allows you to investigate lipid features of interest

Visualize biochemical relationships between individual lipid species and lipid classes through an interactive network-based pathway map

Examine detailed lipid annotations and lipid class enrichment to better understand patterns within your data

Explore raw ion intensity and regression plots to further investigate lipid features

Discover how GMet’s interactive analysis environment can help you explore and interpret your lipidomics data. Complete the form to request a personalized demo and learn how our lipidomics services can support your research.
